Create a Calculation View
- How to create a calculation view in SAP Business Application Studio
- How to use join nodes
- How to use rank nodes
- How to preview the output


 Tracy Wai
 Jan Zwickel
 jmmargo
 Yolanda Chen
 Chaitya Patel
Prerequisites
- You have completed the tutorial to provision an instance of SAP HANA Cloud, SAP HANA database
- You have completed the tutorial to import the sample data needed for this mission
- You have set up a development project in SAP Business Application Studio and connected it to your database
Reminder: This tutorial is part of a mission, in which you will help Alex, the CEO of Best Run Travel, to answer a concrete business question with SAP HANA Cloud, SAP HANA database.
Alex needs to know the top 5 partners of their agency and wants to find out the days with maximum booking of each partner.

In this tutorial, you will learn how to create a calculation in SAP Business Application Studio, in which you will join tables and rank results to get Alex the business insights they need.
- Step 1
-
Within your project in the SAP Business Application Studio, click on View from the side menu. Then click on Command Palette. Alternatively, use
Ctrl+Shift+Pto access it. -
Type SAP HANA: Create HANA database artifact and press
Enteror click on the right option. -
Under Path, ensure that the path to the calculation view is created inside the
srcfolder of your project. -
You will see a form appear on the right-side of the screen. Select Calculation View as your artifact type.
-
Type a name for your calculation view, such as
calculationView. -
Leave the rest of the options as they are. Finally, click on Create.

-
- Step 2
-
The calculation view will open automatically upon creation.
-
In this example, start with a join node to join two tables. Click on the join icon on the sidebar of the editor and then click anywhere on the canvas.

-
The join node appears. Next to the node, click on the plus icon to add the tables.

-
On the pop-up, start by selecting the user-provided service on the Services drop-down list.

-
Uncheck Show only local objects and search for the
SAGENCYDATAtable, which we created in a previous tutorial.If you want to see all objects available via the connection service, enter
**in the search field. -
We can find the top 5 partners for Best Run Travel by joining the
SAGENCYtable with theSTRAVELAGtable. Also add theSTRAVELAGtable to the join node. -
Once both objects are selected, click on Create Synonym.

-
Click on Finish without selecting any other options.

-
In your file explorer, a new file will appear ending with
.hdbsynonym. In this file, your synonyms are defined and stored. Go back to the calculation view editor and you should see the two tables in the join node.
-
- Step 3
-
To properly join the two tables, you need to define how they relate to each other. This is done by editing the join node.
-
Double click the join node to open the settings.
-
Under Join Definition, click on the column
AGENCYNUMfrom one of the tables and drag and drop it on top of the same column from the second table. This determines the key column.
-
Click on the Mapping tab. Here you can select which columns will be part of the output. Select the columns
AGENCYNUM,NUMBOOKING, andNAMEby double clicking on them. You can see they are added to the output section on the right.
-
Close the join settings by clicking on the
Xicon at the top right corner. -
Now connect the join node to the aggregation node above it. Just click on the arrow icon of the join node and drag and drop it on the aggregation node.

-
- Step 4
-
Since we want to see the top 5 results from this join, we will add a Rank node next.
Click on the rank icon. (
) then click on the link between Join node and Aggregation node. This will add a Rank node in between them.

To make it easier to view the nodes, you can click on the Auto Layout icon (
) to rearrange the canvas.
-
Next, double click the Rank node to open the settings.
-
Under Mapping, make sure all 3 columns are included in the output.

-
Click on Definition. Choose the Aggregation Function as
Rank. -
Set the Result Set Direction as
Top. This will order the results descending from highest to lowest. -
Set the Result Set Type as
Absolute. This setting determines the unit of values given out by the rank. You could, for example, also selectPercentagehere to get the top 10% of results. -
On the Target Value, type
5. This will determine the number of values given out as a result. -
The Offset should be
0. Offset determines a number of values that are skipped in the result, for example, with anOffset = 1the first value of the rank result would not be reported. -
Then click on Sort Column to expand this area.
-
Click on the plus icon to add a Sort Setting. Select the column
NUMBOOKINGSand the direction as Descending.
-
Now close the Rank node panel and double click on the Aggregation node.
-
Under Mapping, make sure all columns are selected as part of the output. If a column is not mapped to the output, double click it to add it.

-
- Step 5
-
Now deploy the calculation view. In the SAP HANA Project panel next to the calculation view name or on the top right corner of the screen, click on the deploy icon (
). This will deploy the calculation view. Once this is successfully completed, it’s time to check the output so far.
-
To access the data preview, click on the HDI container icon (
) next to the name of the project. This will open a new tab with the SAP HANA database explorer.
-
On the list of databases, you will now see the HDI container that represents your calculation view. Expand the catalog of that HDI container, then click on Column Views.
-
Next, click on the name of your calculation view on the panel below the catalog and click on Open Data.

-
Then, click on Raw Data to see the output of this calculation view so far.
-
This shows you the top 5 partners of Best Run Travel.

You can also preview the results of your calculation view directly in the calculation view editor in SAP Business Application Studio. Right-click on the aggregation node and select Data Preview. This will open the data preview inside the calculation view editor.


-
- Step 6
Now that we know the top 5 partners, we need to next find out on which days the top 5 travel agencies have the most bookings. To achieve this, we will add the table
SAGBOOKDAYSto our view.-
Continue working on the same calculation view.
-
We will join the output of our rank node to the table
SAGBOOKDAYS, which we previously created. Add a join node between the rank node and the aggregation node by clicking their connection link.Remember, you can use the Auto Layout icon (
) to keep the canvas tidy. -
Since the Join node is connected to Rank 1, its output is already added to the join node. So, you only need to add the
SAGBOOKDAYStable by clicking on the plus icon on the mapping tab. Follow the steps you previously took to add a table and create a synonym.

-
After the table is there, double click on the second join node.
-
Under Join Definition, connect the column
AGENCYNUMfrom Rank 1 to theAGENCYNUMcolumn from theSAGBOOKDAYStable.
-
On the same panel, under Mapping, make sure the following columns are selected for the output:
AGENCYNUM,NUMBOOKING,NAME,ORDERDAYandDAYCOUNT.
-
- Step 7
-
To find the days with the most bookings, add another rank node between Join 2 and the Aggregation node. Click on the rank icon (
) and then on the connection between the Join 2 and the Aggregation nodes.
Remember, you can use the Auto Layout icon () to keep the canvas tidy. -
Double click the rank node to open it.
-
Under Mapping, make sure all 5 columns appear in the Output Columns. If not, double click to add them.

-
Then, click on Definition. Adjust the settings similar to STEP 4:
- Aggregation Function:
Rank - Result Set Direction:
Top - Result Set Type:
Absolute - Target Value:
1(this is different from STEP 4) - Offset:
0
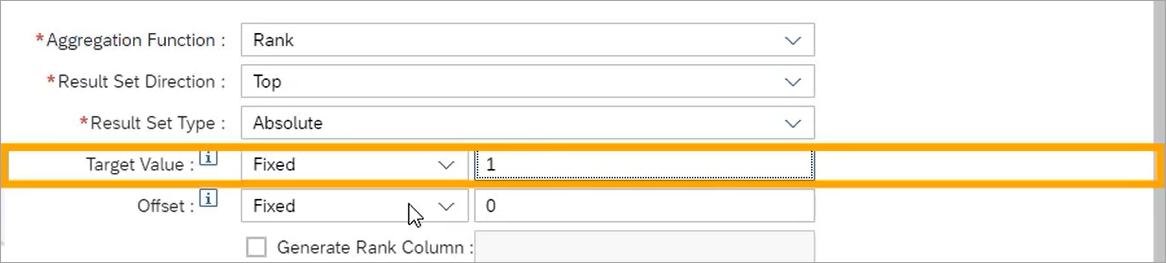
- Aggregation Function:
-
Now click on the Partition Column area, and then click on the plus icon.
What does a partition column do?
Defining a partition column will group the rows of the output based on a specific column.

-
Add the column
AGENCYNUMto group the rows based on this column.
-
Click on Sort Column and click on the plus icon. Add the column
DAYCOUNTand select the sort direction as Descending. You can now close the rank settings.
-
Double click the Aggregation node. Under Mapping, make sure all the columns under the Rank are selected for the output. To add a column to the output, simply double click it.

-
- Step 8
You are almost done!
-
On the SAP HANA Project panel, click on the deploy icon(
) next to the calculation view name. This will deploy the calculation view. Once this is successfully completed, it’s time to check the output again. -
To access the Data Preview in the SAP HANA database explorer, click on the HDI container icon(
) next to the name of the project or access it directly.
-
On the list of databases, you will now see the HDI container that represents your project. Expand the catalog of that HDI container, then click on Column Views to find your calculation view.
-
Next, click on the name of your calculation view on the panel below the catalog. Then click on Open Data.

-
From here, you can click on Raw Data to see the output of this calculation view. This shows you the top 5 partners of Best Run Travel and the day in which they have the most bookings.

Well done!
You have completed the eighth tutorial of this mission! You learned how to create a calculation view in SAP Business Application Studio using the graphical calculation view editor. You used join and rank nodes to get Alex the business insights they were looking for. Now, all that’s left to do is make this calculation view available to others in Alex organization. Learn in the last tutorial how to do that!
-