Access SAP HANA Cloud Alerts and Metrics using a REST API
- How to use the REST API to access alerts, metrics, and metering
- How to use the SAP HANA Cloud REST APIs with one instance or multiple instances


 Joshua Margo
Prerequisites
- Access to an SAP HANA Cloud free tier, trial, or production instance
- A tool such as the REST Client extension for Visual Studio Code enabling the calling of a REST API
Alerts can inform you of potential issues that should be addressed or investigated. Metrics provide measurements for a given time or interval that can aid in troubleshooting or root-cause analysis of issues. As an example, after receiving an alert of type HDBLongRunningStatement, a follow up step may be to investigate metric values such as HDBCPU and HDBMemoryUsed in the period around the time that the alert occurred. Metering provides details into the consumption in cost units or CU for instances.
REST APIs provide a simple and easy to consume method to enable access to alerts, metrics, and metering details.
Accessing alerts, metrics, and metering for a data lake Relational Engine is covered in step 6.
- Step 1
There are multiple tools that enable making calls to a REST API such as Postman, browser extensions, libraries in programming languages such as requests in Python or https in Node.js. Feel free to use the tool of your choice. This tutorial will be using the REST Client extension for Visual Studio Code.
-
If required, download Visual Studio Code.
-
Create a folder and a text file that will contain REST API calls and open the file with Visual Studio Code.
Shell (Microsoft Windows)Copymkdir %HOMEPATH%\AlertsMetricsMeteringTutorial cd %HOMEPATH%\AlertsMetricsMeteringTutorial code AlertsMetricsMetering.http -
Paste the following into the opened file and save it.
HTTPCopy#Example REST API call #From https://stackoverflow.com/questions/5725430/http-test-server-accepting-get-post-requests and GET https://httpbin.org/get?firstname=Bob&lastname=Smith ### #Example REST API call #From https://www.twilio.com/blog/2017/08/http-requests-in-node-js.html GET https://api.nasa.gov/planetary/apod?api_key=DEMO_KEY ### #Pet Store #From https://petstore.swagger.io/#/pet/findPetsByStatus GET https://petstore.swagger.io/v2/pet/findByStatus?status=available ###The # is used as a single line comment character and ### is used to separate REST API calls.
-
Add the REST Client extension from Marketplace after opening the extensions view.

-
Try calling the sample REST APIs by clicking on the blue text
Send Request.
The results should appear in another pane. An example result is shown below.

Notice that the URL includes the URL parameters
firstnameandlastname. The first parameter is indicated with a?, while the subsequent parameters are indicated by an&.
-
- Step 2
The following steps are required to create a bearer token that will be used in subsequent steps that make REST API calls for a single SAP HANA Cloud, SAP HANA database instance. The bearer token is generated by a login request and can be understood as “give access to the bearer of this token”. Additional details can be found at User Account and Authorization Service for Cloud Foundry. Alerts, metrics, and metering for multiple instances including SAP HANA database and data lake Relational Engine instances using the admin-api-access plan is covered in step 6.
-
In the SAP BTP Cockpit, navigate to the Instances section, select your SAP HANA Cloud instance.

Create a service binding (Other Environments) or service key (Cloud Foundry) if one does not exist.

When creating a service binding or service key, a JSON file or parameters section is not needed and can be left empty.
-
View the created service key. The next step will require the
host,uaa.url,clientid, andclientsecretvalues.
-
Replace the contents of AlertsMetricsMetering.http file with the contents below. Highlighted values are to be updated with details from your service key.
HTTPCopy#REST CLIENT VARIABLES --------------------------- #From first part of host. Example shown below @serviceInstance = f2a41f04-3eb7-441b-875f-df9e3fe6d8c2 @oauth = oauth/token?grant_type=client_credentials #From the uaa.url field. Example value shown below @uaa_url = https://tracy-wai-ie3a8mut.authentication.us30.hana.ondemand.com #From the clientid field. Example value shown below. @clientid = sb-f2a41f04-3eb7-441b-875f-df9e3fe6d8c2-6414!b5208|hc-us30-apigateway-hana-cloud!b2649 #From the clientsecret field. Example value shown below. @clientsecret = 381b11e9-29c4-44ed-b609-2c937dcfa5c1$z8euxr_CXT2L9Wb_RRWaOtNxM5ZvhUbyBQp7ZvLS7Wc= #Provides start and end timestamps for alerts or metrics using REST Client plugin's dynamic variables @startTSAlerts = {{$datetime iso8601 -4 d}} @endTSAlerts = {{$datetime iso8601 -3 d}} @startTSMetrics = {{$datetime iso8601 -2 h}} @endTSMetrics = {{$datetime iso8601 -1 h}} @startTSMetering = {{$datetime iso8601 -6 h}} @endTSMetering = {{$datetime iso8601 -1 h}} #Generated by the request bearer token call. Copy the access_token value from the result without the quotes @bearer = #AUTHORIZATION REST API CALL --------------------- #Request Bearer Token GET {{uaa_url}}/{{oauth}} Authorization: Basic {{clientid}}:{{clientsecret}} ### -
Execute the Request Bearer Token call using the Send Request link. Copy the returned
access_tokenvalue to the bearer variable on line 24 of the file AlertsMetricsMetering.http. Do not include the double quotation marks.
-
- Step 3
The following instructions will show a few examples of how to view the list of triggered SAP HANA Cloud, SAP HANA database alerts. If there are no alerts returned, visit the Alerts in SAP HANA Database and Data Lake tutorial to see examples of how to generate a few alerts, including a test alert.
-
Add the following variables to the end of the REST Client variables section of the
AlertsMetricsMetering.httpfile. Update the highlighted value from your service key.HTTPCopy@gateway_url = https://api.gateway.orchestration #From host, part after instanceID.hana @host = prod-us30.hanacloud.ondemand.com -
Add the following calls to the bottom of the
AlertsMetricsMetering.httpfile after the line with ###.HTTPCopy#ALERT REST API CALLS ---------------------------- #Get the triggered alerts (events) for a specific instance GET {{gateway_url}}.{{host}}/alerts/v1/serviceInstances/{{serviceInstance}}/events?alertState=All&severity=INFO,NOTICE,WARNING,ERROR Authorization: Bearer {{bearer}} ### #Get the triggered alerts (events) for a specific instance for a specific time period such as 4 days ago #The data is kept only for a certain duration, such as 7 days #Note that only alerts that have an endTimestamp are returned GET {{gateway_url}}.{{host}}/alerts/v1/serviceInstances/{{serviceInstance}}/events?alertState=All&severity=INFO,NOTICE,WARNING,ERROR&startTimestamp={{startTSAlerts}}&endTimestamp={{endTSAlerts}} Authorization: Bearer {{bearer}} ### #Get the triggered alerts (events) that are still active GET {{gateway_url}}.{{host}}/alerts/v1/serviceInstances/{{serviceInstance}}/events?alertState=Active&startTimestamp={{startTSAlerts}} Authorization: Bearer {{bearer}} ###Alert data is only persisted for a fixed amount of time after the current date such as 7 days.
The
endTimestampis optional. -
Try out the /events calls.

-
Available alert rules can also be accessed with the REST API. Add the following content to
AlertsMetricsMetering.httpto the REST Client variables section.HTTPCopy#A specific alert rule @alertRule = HDBDiskUsage -
Add the following calls to the bottom of the REST API calls section of the
AlertsMetricsMetering.httpfile after the last line with ###.HTTPCopy#Get the list of alerts (rules) for a specific instance GET {{gateway_url}}.{{host}}/alerts/v1/serviceInstances/{{serviceInstance}}/rules Authorization: Bearer {{bearer}} ### #Get the alert rules for a specific alert rule and for a specific instance GET {{gateway_url}}.{{host}}/alerts/v1/serviceInstances/{{serviceInstance}}/rules/{{alertRule}} Authorization: Bearer {{bearer}} ### -
Try out the /rules calls. The first call will return a list of all alert rules.

The second call will return only the information for the
HDBDiskUsagealert rule.
For additional details on the alerts REST API, see APIs for Alerts, SAP HANA Cloud Service Database Events, and Alert Service for the Business Accelerator Hub.
-
- Step 4
The following instructions will show a few examples of how to view metrics through a REST API in SAP HANA Cloud, SAP HANA database.
-
Add the following calls to the bottom of the REST API calls section of the
AlertsMetricsMetering.httpfile after the last line with ###.HTTPCopy#METRICS REST API CALLS -------------------------- #Get the list of the available metrics (definitions) GET {{gateway_url}}.{{host}}/metrics/v1/serviceInstances/{{serviceInstance}}/definitions Authorization: Bearer {{bearer}} ### #Get the metric HDBMemoryUsed (values) GET {{gateway_url}}.{{host}}/metrics/v1/serviceInstances/{{serviceInstance}}/values?names=HDBMemoryUsed Authorization: Bearer {{bearer}} ### #Get the metric HDBMemoryUsed (values) for a specific time range, such as 2 hours ago GET {{gateway_url}}.{{host}}/metrics/v1/serviceInstances/{{serviceInstance}}/values?names=HDBMemoryUsed&startTimestamp={{startTSMetrics}}&endTimestamp={{endTSMetrics}} Authorization: Bearer {{bearer}} ###Metrics data is only persisted for a fixed amount of time after the current date such as 7 days.
The
endTimestampis optional. -
Try out the /definitions call to get a list of the available metrics.
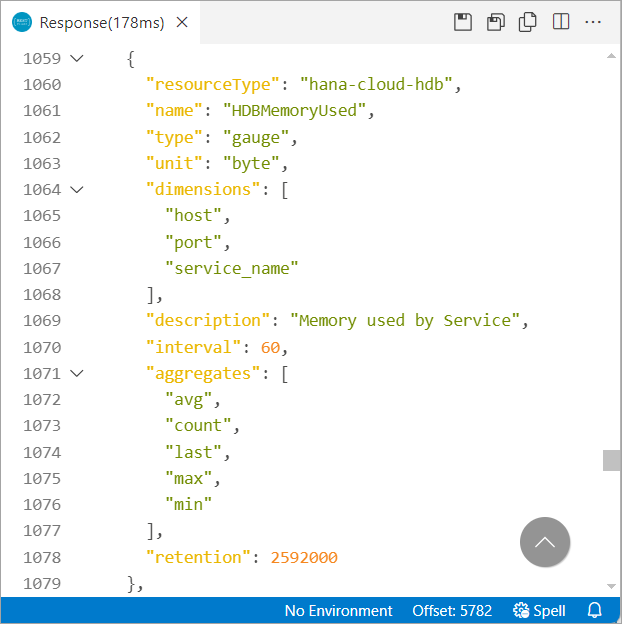
A few of the returned values are explained below:
-
resourceTypewhose value is hana-cloud-hdb indicates that this entry applies to an SAP HANA Cloud, SAP HANA database. -
typecan be a gauge suchHDBMemoryUsed, or a delta such asHDBCSUnloadCount. A
gauge reflects the current value of a metric at a specific time while a delta represents a value within an interval. -
unitsuch as %, ms (milliseconds), bytes, or an empty value for a count. -
intervalor frequency (1 minute) that the metric is collected. -
retentiontime (30 days) is shown in seconds. If a start and end time are not specified, the default is to return values from the last hour. -
countis shown at the end of the JSON request. In this case there were 48 metrics available.
-
-
Try out the /values call to see the values for a specific metric.

As seen above the memory used at 13:02 was approximately 4.98 GB. Of note is that these metrics are recorded for multiple services. In the above example port 30040 corresponds to the index server service.

Metrics can also be accessed via SQL queries. For additional details see
M_LOAD_HISTORY_SERVICESystem View. Note that when accessing metrics via SQL queries, the database must be accessible as the data is stored in the database. When accessing metrics via the REST API, the metrics data is stored outside of the database.For additional details on the metrics REST API, see APIs for Metrics, Overview of Available Metrics, and Metrics Service on the Business Accelerator Hub.
-
- Step 5
The following instructions will show a few examples of how to view metering details through a REST API in SAP HANA Cloud, SAP HANA database.
-
Add the following calls to the bottom of the REST API calls section of the
AlertsMetricsMetering.httpfile after the last line with ###.HTTPCopy#METERING REST API CALLS -------------------------- #Get the list of the available metering metrics (definitions) GET {{gateway_url}}.{{host}}/metering/v1/serviceInstances/{{serviceInstance}}/definitions Authorization: Bearer {{bearer}} ### #Get the metering metric DefaultNodeMemory for the default duration of 1 hour (values) GET {{gateway_url}}.{{host}}/metering/v1/serviceInstances/{{serviceInstance}}/values?names=DefaultNodeMemory Authorization: Bearer {{bearer}} ### #Get the metering metrics BackupStorage and NetworkEgress (values) GET {{gateway_url}}.{{host}}/metering/v1/serviceInstances/{{serviceInstance}}/values?names=BackupStorage,NetworkEgress Authorization: Bearer {{bearer}} ### #Get the metric NetworkEgress (values) for a specific time range, such as the last 6 hours GET {{gateway_url}}.{{host}}/metering/v1/serviceInstances/{{serviceInstance}}/values?names=NetworkEgress&startTimestamp={{startTSMetering}}&endTimestamp={{endTSMetering}} Authorization: Bearer {{bearer}} ###Metering data is only persisted for a fixed amount of time after the current date such as 30 days.
The
endTimestampis optional. -
Try out the /definitions call to get a list of the available metrics.

A few of the returned values are explained below:
-
resourceTypewhose value is hana-cloud-hdb indicates that this entry applies to an SAP HANA Cloud, SAP HANA database. -
A
typevalue ofdeltarepresents a value within an interval. -
intervalor frequency that the metric is collected, in this case 1 hour or 3600 seconds. -
retentiontime (30 days) is shown in seconds. If a start and end time are not specified, the default is to return values from the last hour. -
countis shown at the end of the JSON request. In this case there were 22 metering metrics available.
-
-
Try out the /values call to see the values for a specific metering metric.

As seen above the cost unit consumption value for memory is .736 for the last hour.
For additional details on the metering service REST API, see Metrics in SAP HANA Cloud, Metering Metrics, and Metering Service on the Business Accelerator Hub.
-
- Step 6
If you wish to access alerts, metrics, and metering for multiple instances with one API call or update alert thresholds, the service plan admin-api-access can be used as shown below. This service plan is not available for trial instances. For non trial instances, it supports both SAP HANA Cloud, SAP HANA database instances and data lake instances.
-
Ensure the service plan admin-api-access appears under the service SAP HANA Cloud. If required, select Add Service Plans and enable the entitlement.

-
Create a service instance.

In the parameters section, add the below JSON.
JSONCopy{ "technicalUser": true }
Click Next, and then Create.

-
Create a service binding.

Provide a binding name and press Create.
-
Create a new file named AlertsMetricsMetering2.http file with the contents below. Highlighted values are to be updated with details from the service binding created in the previous step and optionally an instance ID.
HTTPCopy#REST Client variables ------------------- @oauth = oauth/token?grant_type=client_credentials #From the uaa.url field. Example value shown below @uaa_url = https://dansftsubaccount.authentication.ca10.hana.ondemand.com #From the clientid field. Example value shown below. @clientid = sb-19ebffce-3592-4cfb-8869-4087a60ce38c!b2030|subaccount-admin-api-xsuaa!b71 #From the clientsecret field. Example value shown below. @clientsecret = c6b58da7-a8a1-48c1-8577-219a7c28e3fa$PsmD4ZRu7mbMeGvip1gmHYrbGWuj67pNqFqkEsEGjQA= #https:// + baseurl @gateway_url = https://api.gateway.orchestration.prod-ca10.hanacloud.ondemand.com #Can be used as a filter, copy from the instance actions menu in SAP HANA Cloud Central @instanceID = f220be69-843c-4a75-b014-85ea4188cdd1 #Provides start and end timestamps for alerts or metrics using REST Client plugin's dynamic variables @startTSAlerts = {{$datetime iso8601 -4 d}} @endTSAlerts = {{$datetime iso8601 -3 d}} @startTSMetrics = {{$datetime iso8601 -2 h}} @endTSMetrics = {{$datetime iso8601 -1 h}} @startTSMetering = {{$datetime iso8601 -6 h}} @endTSMetering = {{$datetime iso8601 -1 h}} #Generated by the request bearer token call. Copy the access_token value from the result without the quotes @bearer = #Authorization REST API call -------------------- #Request Bearer Token GET {{uaa_url}}/{{oauth}} Authorization: Basic {{clientid}}:{{clientsecret}} ### -
Execute the Request Bearer Token call using the Send Request link. Copy the returned
access_tokenvalue to the bearer variable on line 24 of the file AlertsMetricsMetering.http. Do not include the double quotation marks. -
Add the following content to the bottom of the file and try out the examples.
HTTPCopy#Alerts REST API calls -------------------------- #Get the triggered alerts (events) for all instances GET {{gateway_url}}/alerts/v1/events?alertState=All&severity=INFO,NOTICE,WARNING,ERROR Authorization: Bearer {{bearer}} ### #Get the triggered alerts (events) for a specific time period such as 4 days ago #The data is kept only for a certain duration, such as 7 days #Note that only alerts that have an endTimestamp are returned GET {{gateway_url}}/alerts/v1/events?alertState=All&severity=INFO,NOTICE,WARNING,ERROR&startTimestamp={{startTSAlerts}}&endTimestamp={{endTSAlerts}} Authorization: Bearer {{bearer}} ### #Get the triggered alerts (events) that are still active GET {{gateway_url}}/alerts/v1/events?alertState=Active&startTimestamp={{startTSAlerts}} Authorization: Bearer {{bearer}} ### #Update the threshold of a specific alert for a specific instance PATCH {{gateway_url}}/alerts/v1/serviceInstances/{{instanceID}}/rules Authorization: Bearer {{bearer}} { "data": [ { "alertRule": "HDBDiskUsage", "severities": { "NOTICE": { "threshold": "91" }, "WARNING": { "threshold": "96" }, "ERROR": { "threshold": "99" } }, "enabled": true } ] } ### #Verify the threshold values have changed for an alert rule for a specific instance GET {{gateway_url}}/alerts/v1/serviceInstances/{{instanceID}}/rules/HDBDiskUsage Authorization: Bearer {{bearer}} ### #Update the threshold of a specific alert for specific instance(s) PATCH {{gateway_url}}/alerts/v1/rules Authorization: Bearer {{bearer}} { "data": [ { "serviceInstanceID": "{{instanceID}}", "alertRule": "HDBDiskUsage", "severities": { "NOTICE": { "threshold": "89" }, "WARNING": { "threshold": "94" }, "ERROR": { "threshold": "97" } }, "enabled": true } ] } ### #Metrics REST API calls ------------------------- #Get the metric HDBMemoryUsed for multiple SAP HANA Cloud instances (values) GET {{gateway_url}}/metrics/v1/values?names=HDBMemoryUsed Authorization: Bearer {{bearer}} ### #Get the metric HDLCPUUsage for multiple SAP HANA Cloud data lake instances (values) GET {{gateway_url}}/metrics/v1/values?names=HDLCPUUsage Authorization: Bearer {{bearer}} ### #Get the metric HDBMemoryUsed for the indexserver and order the values GET {{gateway_url}}/metrics/v1/values?names=HDBMemoryUsed&$filter=dimensions/service_name eq indexserver&$orderby=values/value desc Authorization: Bearer {{bearer}} ### #Metering REST API calls ------------------------- #Get the metering metric DefaultNodeMemory for multiple SAP HANA Cloud instances (values) GET {{gateway_url}}/metering/v1/values?names=DefaultNodeMemory&$filter=resourceType eq hana-cloud-hdb Authorization: Bearer {{bearer}} ### #Get the metric DefaultNodeStorage for multiple SAP HANA Cloud data lake instances (values) GET {{gateway_url}}/metering/v1/values?names=DefaultNodeStorage&$filter=resourceType eq hana-cloud-hdl&startTimestamp={{startTSMetering}}&endTimestamp={{endTSMetering}} Authorization: Bearer {{bearer}} ###
-