Debug Your SAPUI5 App with SAP Business Application Studio
- How to add breakpoints to your JavaScript code
- How to log data to the console
- How to use the Google Chrome DevTools


- Step 5
Running your application has several advantages over deploying it. Among others, it’s faster, doesn’t require a “build” step and won’t minify your JavaScript codebase.
-
To run the pre-generated run configuration, switch to the Run Configuration panel on the left-hand bar. Click on the ▶️ icon of the first run configuration to add start the SAPUI5 app.

-
Now the SAP Business Application Studio will start the app. When promoted, selected Open to make the local port accessible for debugging.

-
A new tab should open that displays the following page.

-
- Step 6
Open the Chrome DevTools (or the dev tools of your favorite browser) by clicking F12. Refresh the page to run the script one more time.
You should now see that the app reached the breakpoint (the dev tools automatically switched to the
Sourcestab).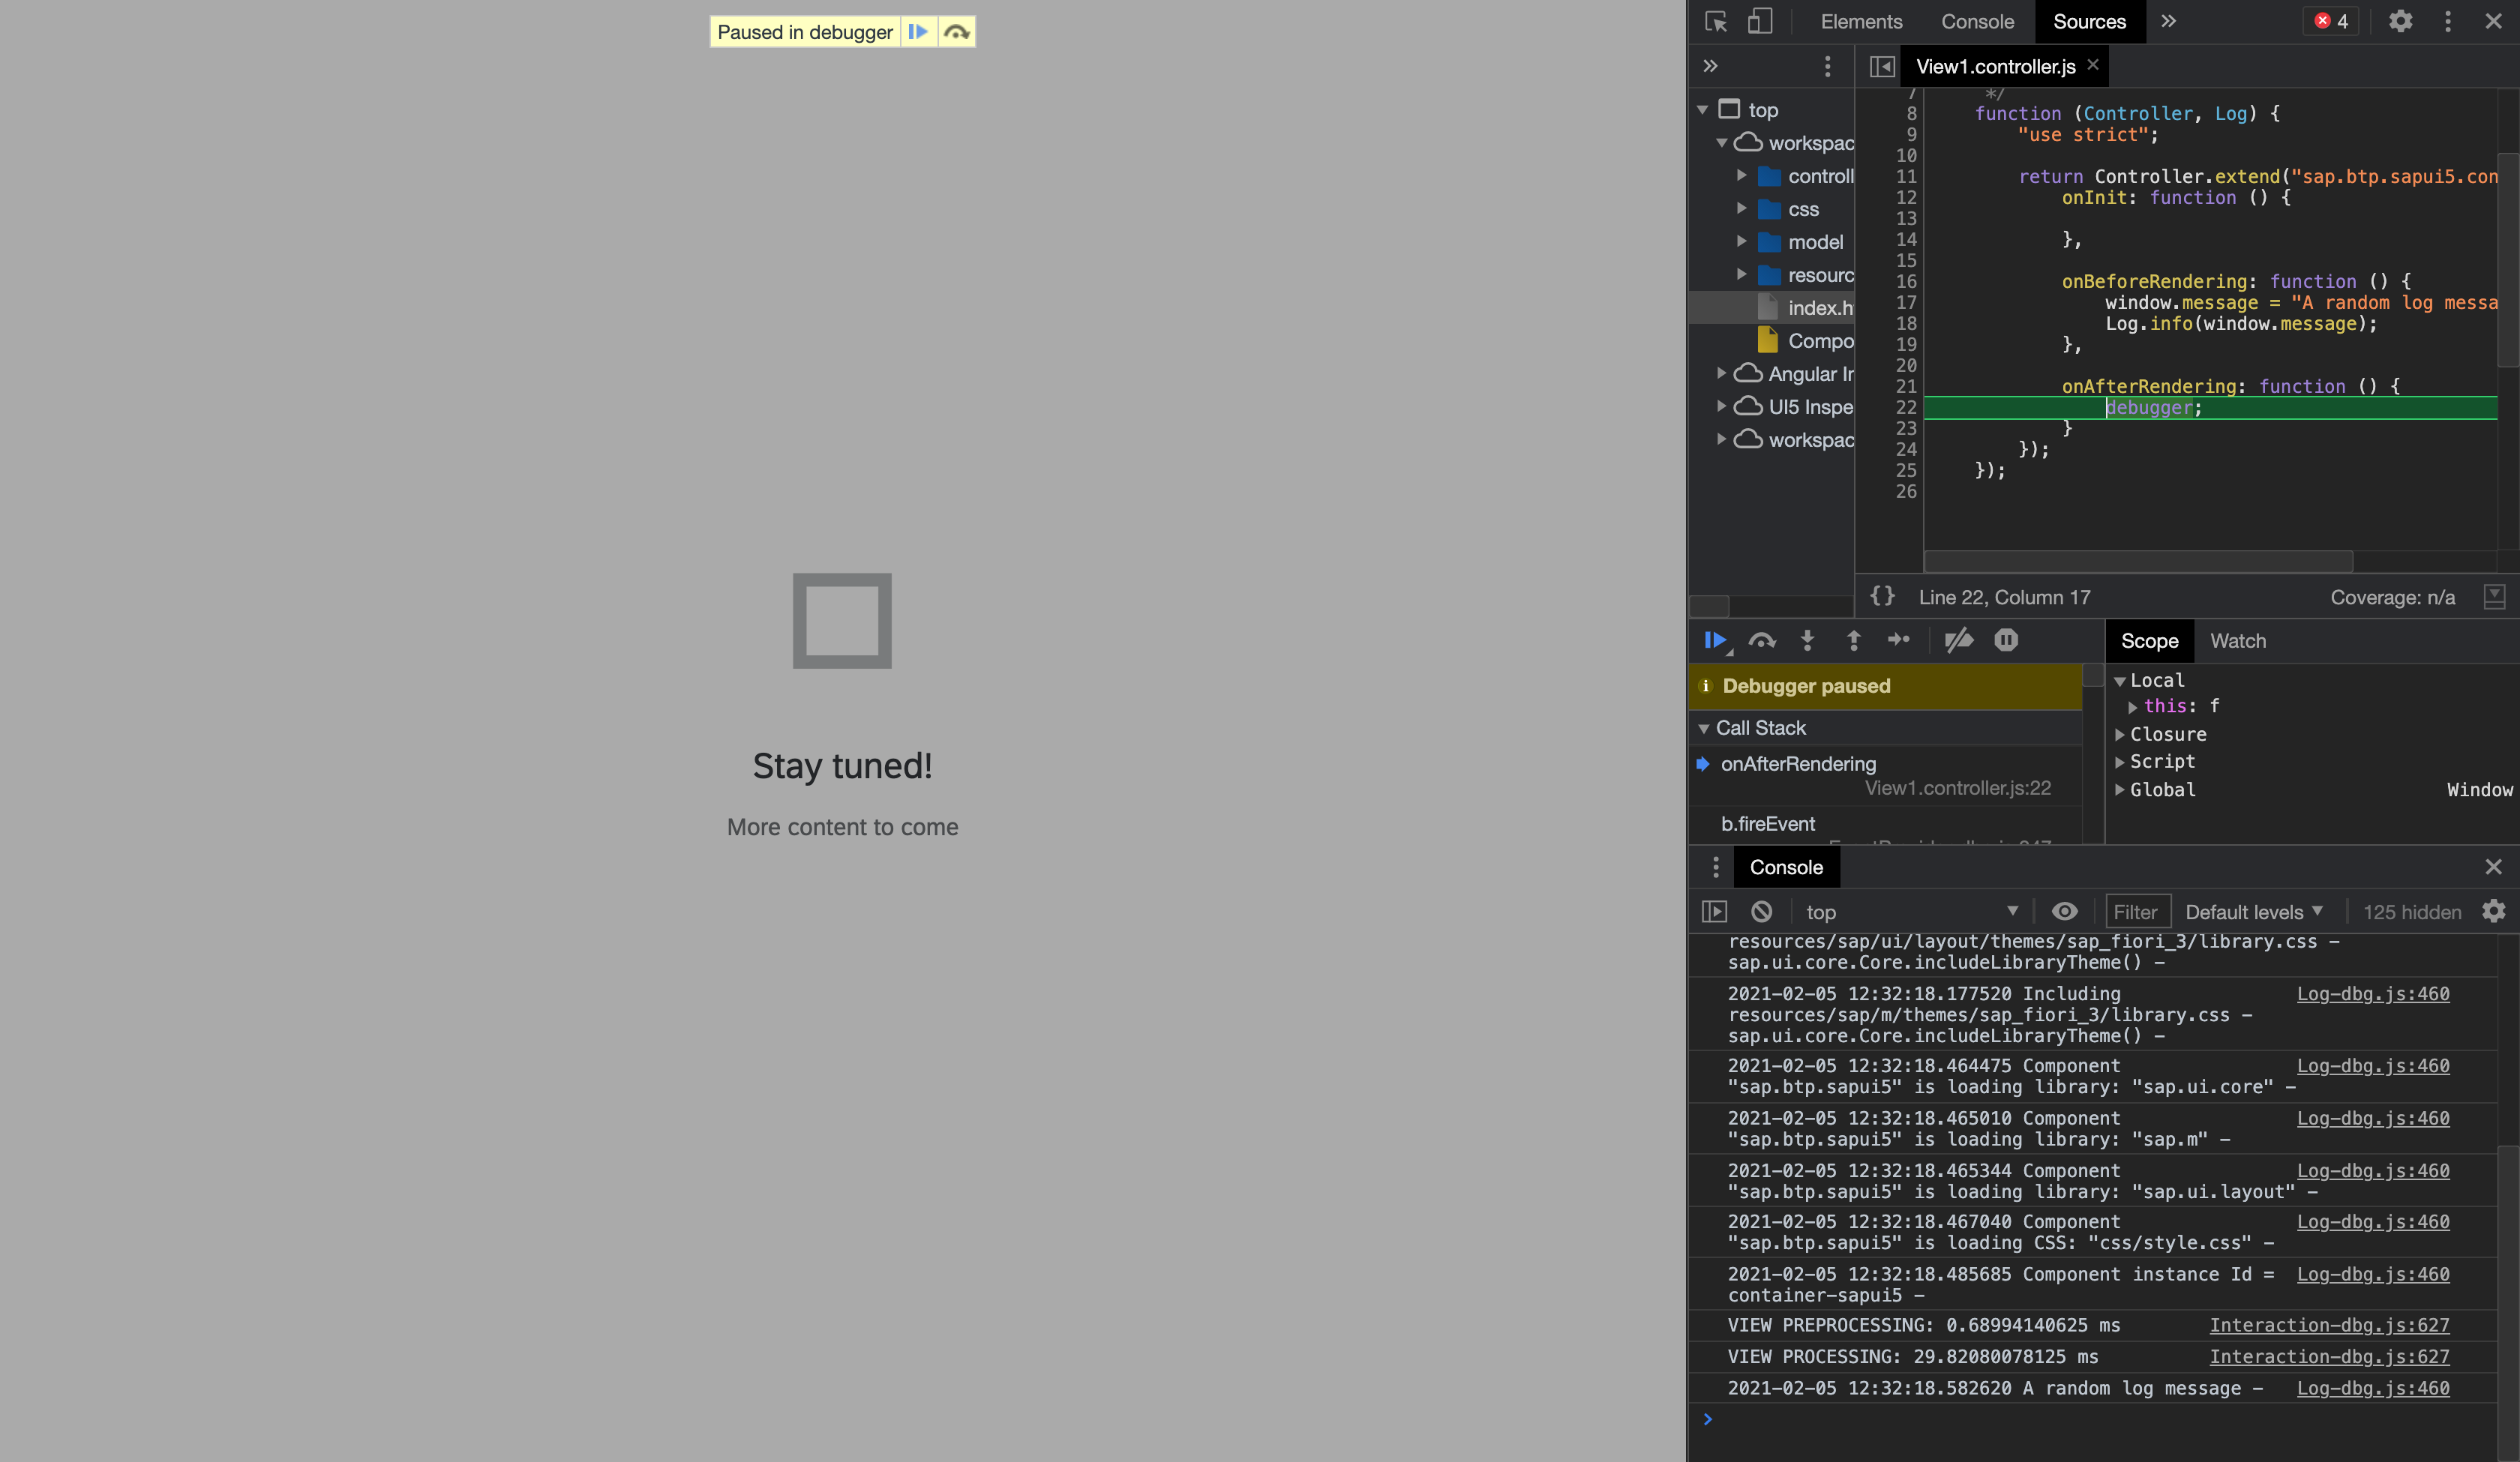
Run
console.log(message.replace("random", "Hello-World"))in the console of the DevTools.What output do you see after running the command?
- Step 7
Click F8 to jump over the breakpoint and switch to the
Consoletab.
Now you should see your error message printed in red.Can you spot the line in which you invoked the error message?
